Grafana Labs adds Knowledge Graph to every Grafana Cloud stack
Grafana Labs announced a Knowledge Graph in every Grafana Cloud stack, plus new Digital Experience Monitoring capabilities and updates to Incident Response Management. The graph links infrastructure, applications and user-facing signals into a shared context model for engineers and AI agents.
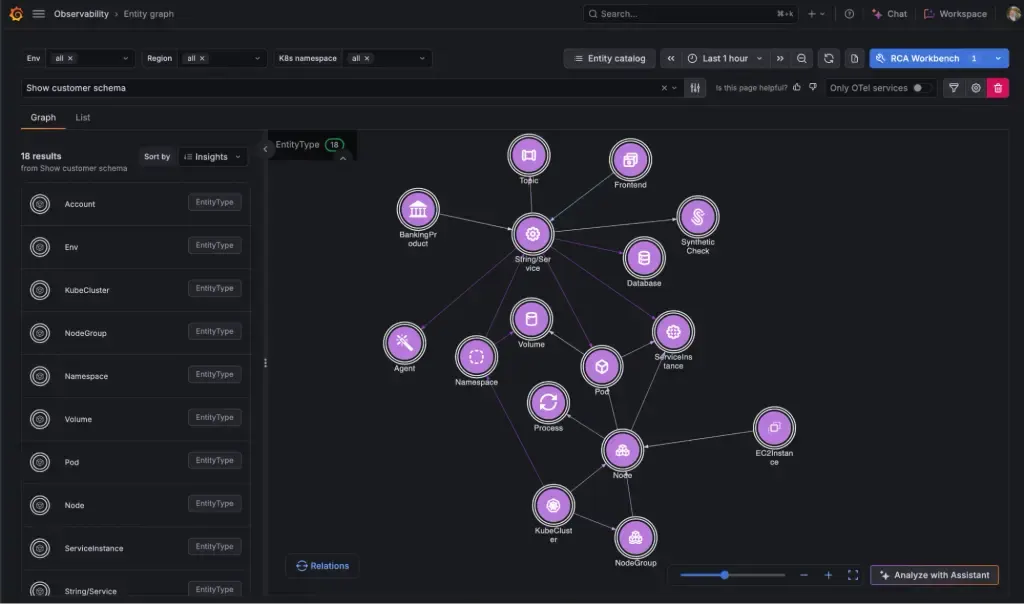
- Knowledge Graph is available in every Grafana Cloud stack
- Session Replay and mobile observability on OpenTelemetry added
- Agents query context via new Cypher capability
- 30% of IT leaders can explain incidents but not prevent them
Read next
AI